
We Predicted Overlay Error to Within Half a Silicon Unit Cell.
A domain knowledge-driven fusion machine learning model for overlay error prediction
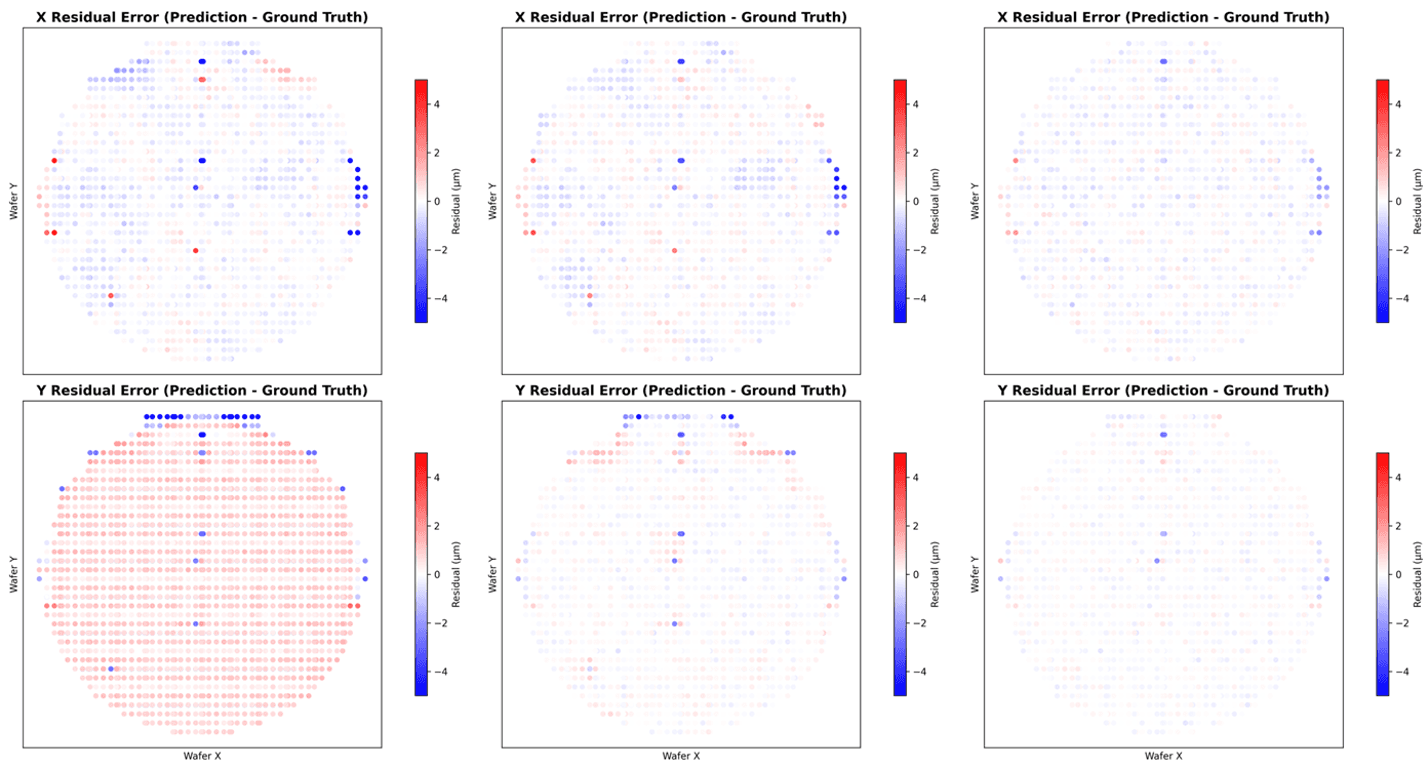
An overlay error prediction model with high average accuracy can still be completely blind to a specific error. Under bimodal deformation — global wafer deformation from scanner-table wear and local deformation from overlay mark deformation occurring at the same time — we compared Linear Regression and XGBoost, both known for high average accuracy, against the domain knowledge-driven fusion model we developed. Our model recorded an average RMSE of 0.259 nm, 78% below Linear Regression and 46% below XGBoost, and recorded a Pearson r above 0.88.
Why average accuracy is the wrong test
As control tightens toward the sub-1nm regime, feedback-only overlay schemes are no longer sufficient. The precision now required is below what physical metrology alone can deliver, and the gap is widening. Process variability is increasing because of product diversification, while metrology throughput stays flat.
High-density sampling is what makes measurement correlate usefully with defect prediction. But tool-to-tool matching noise and long measurement times put a hard ceiling on the actual measurement throughput of a high-volume fab. So the fab measures a subset and infers the rest — which makes the quality of that inference a yield question.
This is where generic machine learning quietly underperforms. Standard models are optimized for average conditions, and they are usually evaluated the same way. But in a production environment, defective wafers and their patterns are rare, so they are not sufficiently represented in the data used for training and evaluation.
Bimodal deformation is a representative example. It occurs when a global signature from scanner-table wear and a localized signature from overlay mark deformation appear on the same wafer at the same time. Each is difficult on its own, and when the two overlap the model learns only half of it. It captures one deformation mode and misses the other, while still reporting a respectable average accuracy.
Pretraining on what production cannot show you
The obstacle to training for these cases is not the model. It is the data. Production data is limited, security-sensitive, and — most importantly — deficient in precisely the signatures that matter most. You cannot collect enough examples of a rare failure to train a model to be robust against it, because if you could, it would not be rare.
So we generate that data ourselves. The Virtual Fab environment generates large-scale synthetic overlay data with physically plausible stochastic patterns. Edge cases that production data does not sufficiently contain are deliberately generated and included in the training data. The resulting data covers everything from normal wafers to gradual time-series drift and bimodal deformation. A foundation model pretrained on it already understands the structure of the overlay error signal within a wafer before it learns from a single real wafer.
The other half is how heterogeneous inputs are combined. Scanner and equipment logs, statistical process summaries and wafer-position-dependent spatial features are fused according to process-domain knowledge. The architecture prioritizes features with a high signal-to-noise ratio and reflects the mechanisms by which overlay error is generated, which is what lets the model separate a real signal from background noise.
The distinction matters: this is a domain knowledge-driven learning framework, not a data-heavy model.
What the benchmark showed
We fine-tuned on 1,400 samples and validated on 600, under intentionally induced bimodal deformation conditions, and compared our model against two baselines known for high average accuracy on RMSE, R² and Pearson correlation.
| Model | RMSE X | RMSE Y | Avg. RMSE | R² X | R² Y | r X | r Y |
|---|---|---|---|---|---|---|---|
| Linear Regression | 0.637 | 1.741 | 1.189 | −0.146 | 0.004 | 0.114 | 0.080 |
| XGBoost | 0.478 | 0.487 | 0.482 | 0.355 | 0.922 | 0.629 | 0.962 |
| Proposed Fusion ML | 0.303 | 0.216 | 0.259 | 0.740 | 0.985 | 0.888 | 0.993 |
RMSE in nm. Bimodal deformation conditions, 1,400 fine-tuning samples, 600 validation samples. R² = 1 − SS_res/SS_tot, which is not the square of Pearson r; unlike r², it can be negative when a model performs worse than a constant-mean baseline.
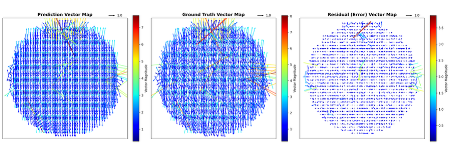
Linear Regression fails to predict under bimodal conditions. Pearson r falls to 0.114 and 0.080, meaning the model captures essentially none of the bimodal structure. In the vector maps, predicted magnitudes span only 0–1.8 nm against a ground truth range of 0–8 nm, an underprediction of roughly 4×.
XGBoost is the more instructive result. Its average RMSE of 0.482 nm looks acceptable. Its Y-direction correlation of 0.962 looks excellent. But r in X is 0.629 — the model learned one deformation mode well and struggled with the other. A single averaged number would have concealed that entirely. Spatially, it recovers the global vector field but leaves residuals up to roughly 6 nm concentrated near the upper wafer edge.
The fusion model holds in both axes. Average RMSE of 0.259 nm — 78% below Linear Regression and 46% below XGBoost — with r of 0.888 and 0.993 and no directional spatial bias. Residual vector magnitudes cap at approximately 3.5 nm, the lowest of the three. The residual map is the clearest evidence: not just smaller errors, but errors without structure.
What this result means
These benchmark results were obtained under one specific bimodal defect scenario, but they are meaningful nonetheless. In the sub-1nm regime, what is required is not a marginal improvement in the average. It is the systematic reduction of edge-case failure. A model that is process-aware by construction handles these cases differently from one that is not, and the difference shows up exactly where it counts, in the direction the averaged metric was hiding.
Which failure mode is your current overlay model hiding behind its average?
If you work on overlay control at advanced nodes, we can run a PoC with a limited dataset. Please contact us to discuss your process, metrology or yield challenge.
This work was presented at SPIE Advanced Lithography + Patterning 2026 (paper 13981-140), “Domain Knowledge-Driven Fusion Machine Learning for Sub-1nm Overlay Prediction Enhancement.”